Live Reporting
As well as the static reporting found under the main Reports window, Easify also includes more Dynamic, Live Reporting feature.
It allows you to search on Product Sales History and Purchase History, and sort and filter the data in a variety of different ways.
Examples of how to utilise this feature for your Customers, Orders, Suppliers and Products can be found on the relevant pages of the Userguide.
Here, however we will just explain how to use the functions of Live Reporting, using the Product Sales History window as an example.
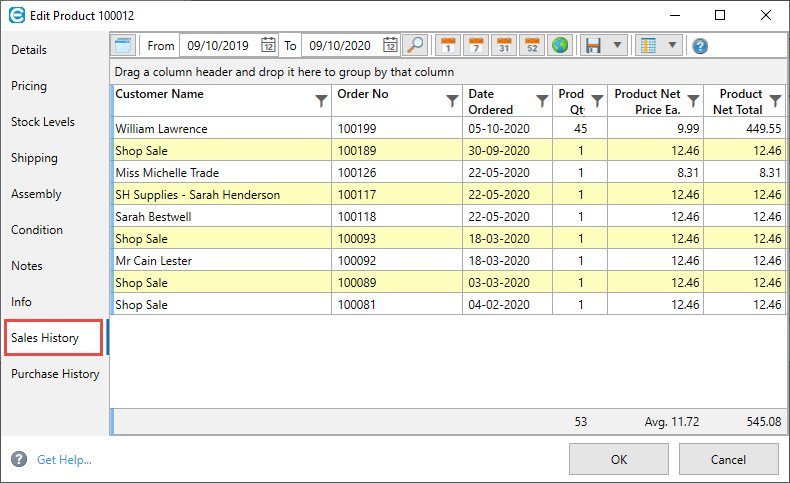
Live Reporting appears on the following windows:
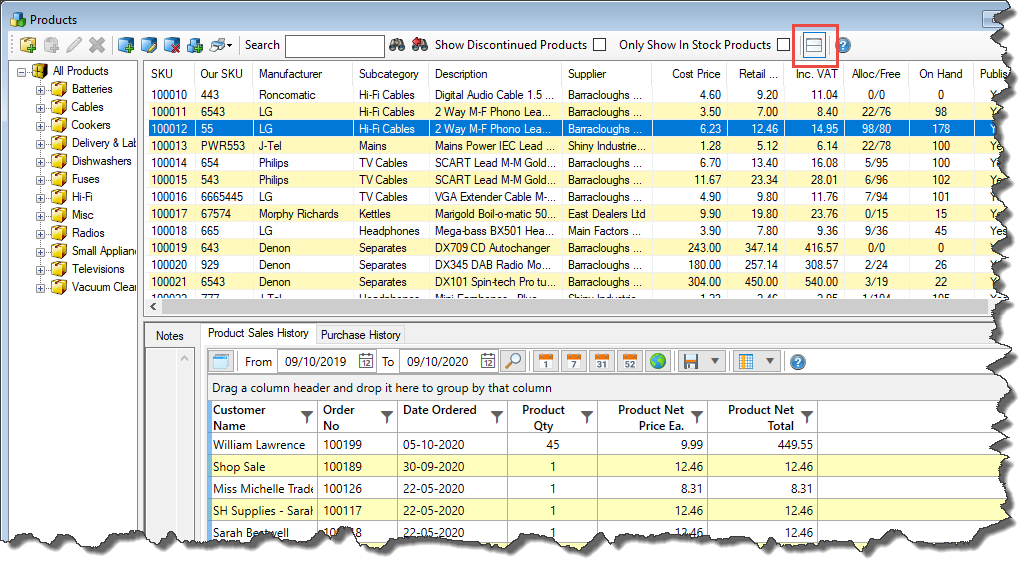
From the Main Products window click on the Show/hide product info pane button as highlighted in red to view the pane if isn't already showing. This will launch the Product Info Pane.
If you make any changes to the layout of the Info/Live Reporting pane, Easify will remember your settings. For instance, if you make the Notes section narrower, it will be narrower until you change it.
Toolbar
We will now explain all the buttons on the toolbar...
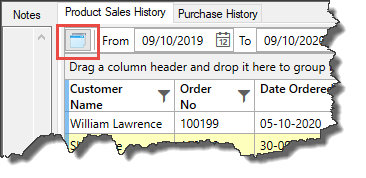
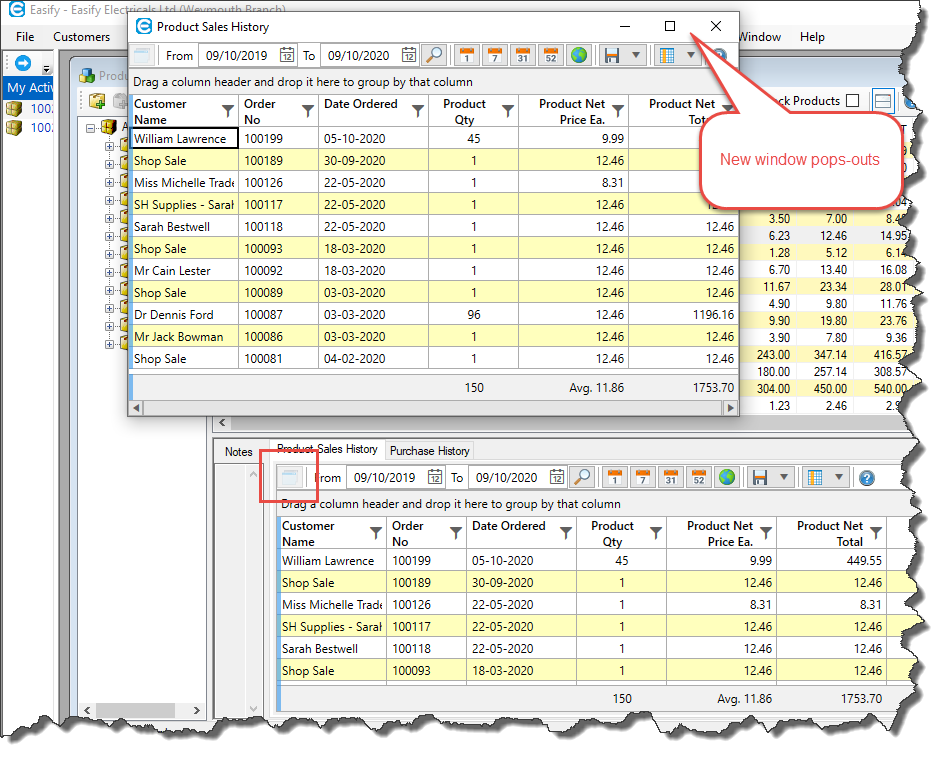
Pop-Out Window
If you click this button, the Live Reporting window will pop-out into a separate window.
This is a handy feature as you can move this pop-out window to another monitor if you use multiple monitors.
Enter Date Range
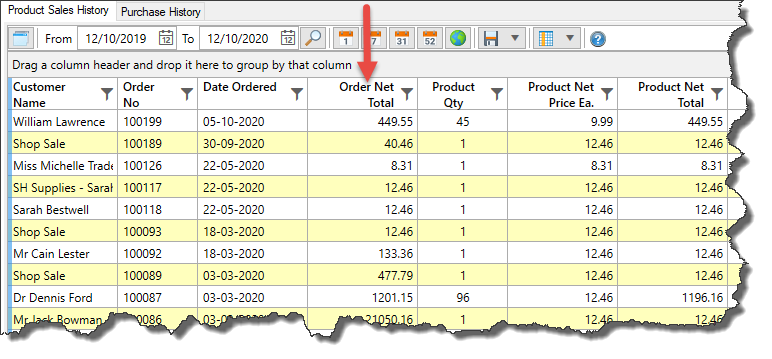
Enter a Date Range for your data by clicking on the calendar buttons and selecting the relevant From and To dates:
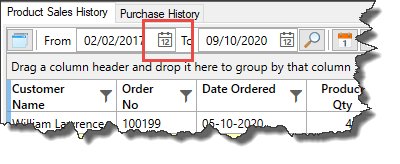
Alternatively you can highlight the text in the date boxes and overtype the contents.
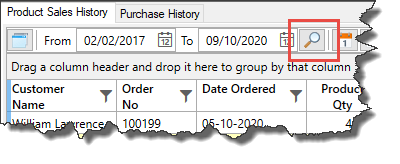
Press Enter or click on the Magnifying glass to run the search:
There are some Quicklink buttons for the most common date ranges - today, last week, last month, last year, all time:
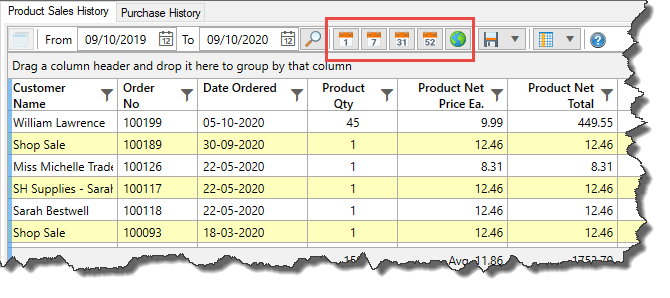
Note: If you click on the 31 button it will show data for the last 31 days, not necessarily the last month. If you select the 52 button it show data for the last 52 weeks, not the last Financial year or a Calendar year. Therefore please use the date pickers if you need a more precise date selection.
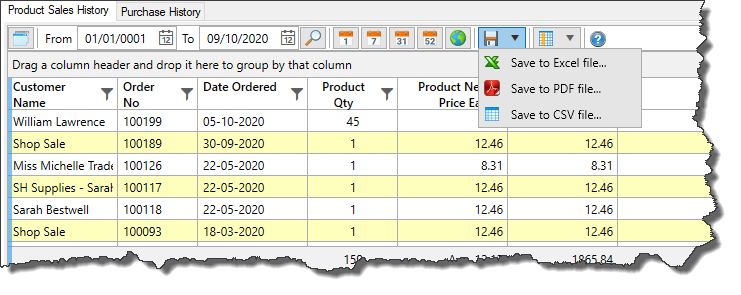
Saving the Results
You can save the data shown in the Live Reporting pane to either Excel, PDF or CSV file.
Note: The files will save to a physical hard drive on your PC or laptop not on the Easify Cloud, even if you have an Easify Cloud Server subscription. Therefore if the results are important and you don't wish to lose them, it's worth ensuring that they are backed up.
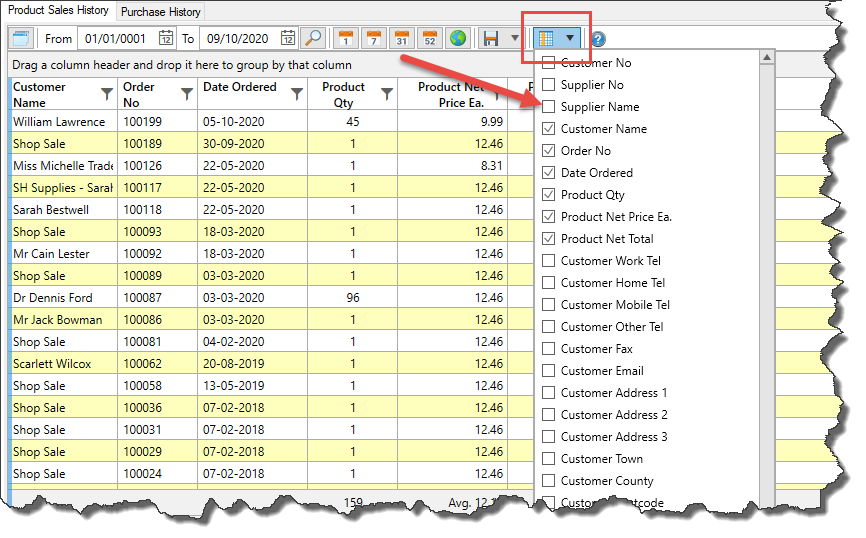
Adding Columns
You can add columns to the view. Click on the dropdown arrow next to the Choose Columns and all the columns that are available for that view will show. If you tick the box next to the column description, the relevant column will then display in this window, and you will be able to sort and filter by it.
To stop displaying a column, just untick the box.
Note: As you add more columns to this view, it may be slower to generate the history. If you are finding it slow to load, then chose a smaller date range or de-select some of the columns.
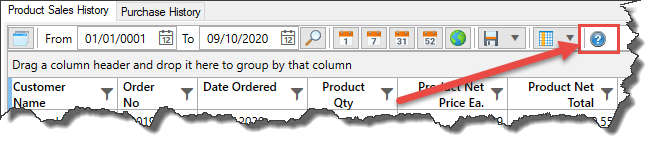
Help
As with all the other windows in Easify, if you click this button it will take you to the relevant section on the userguide on our website.
Additional Functions
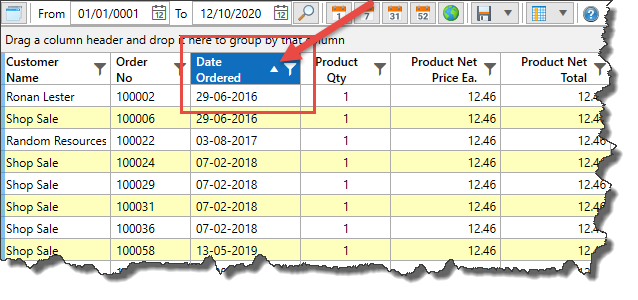
Sorting
You can sort by each column by clicking on the column header.
An arrow will appear to show that the data is being sorted by that column. If you click the column header again it will resort in the opposite order. Click again, and it will turn off the sorting by that column.
When sorting, make sure that you don't accidentally click the funnel as that will bring up another utility.
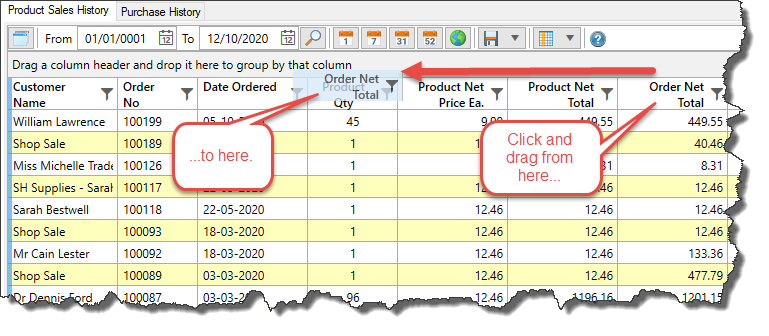
Changing Column Order
You can change the order of the Columns by clicking on the column header and dragging it to where you want it displayed.
 Any changes you make to the layout will be remembered for the next time you access this Live Reporting pane.
Searching
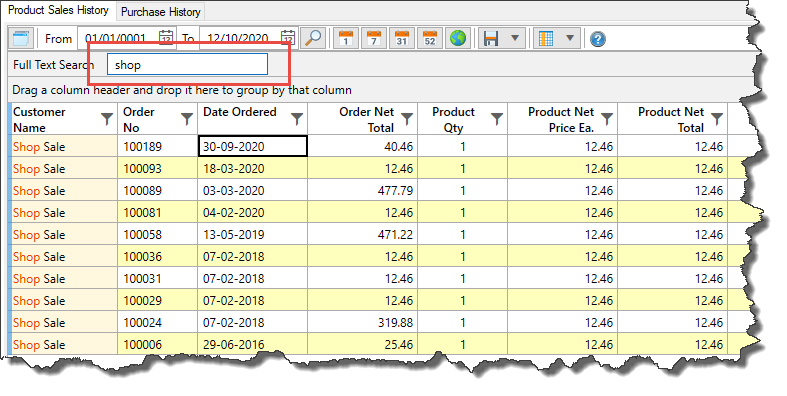
You can press Ctrl F from within the Live Reporting pane to search for data within the view. For instance you might only want to see the shop sales for a particular product, so you could search for shop to narrow down the results.
Column Freeze Bar
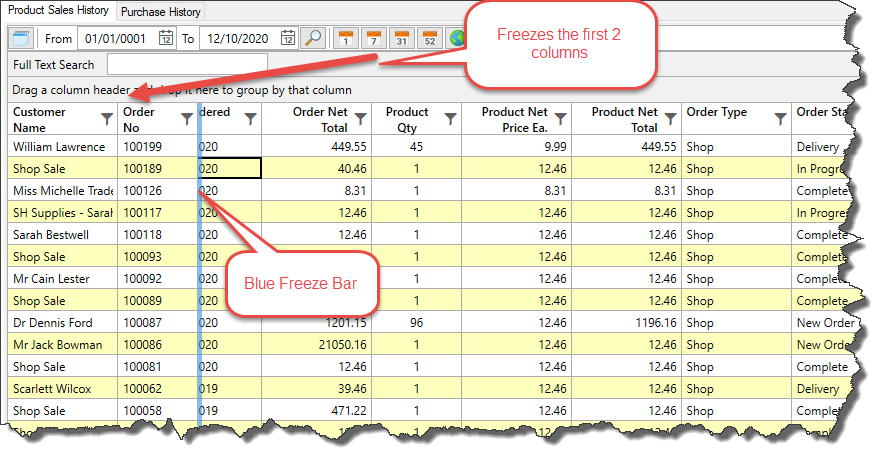
The Column Freeze Bar can be found on the left hand side of the Live Reporting pane. It shows as a Blue Strip.
You can drag the freeze bar to freeze the first column or the first few columns.
In the example below it has been used to freeze the first two columns. As you scroll through the columns, the first two will remain static. Don't forget you can change the order of the columns too as explained above.
Filtering
Click on the Funnel on the column header to launch the Filtering Tool.
Depending on the sort of data in the column, the filtering tool will allow you filter by various criteria.
For instance if you click on the Customer column in the example below, you can filter by customer name by ticking the tickbox next to a name. However you won't be able to enter anything into the boxes where is says 'is equal to' as this doesn't make sense on a text only column.
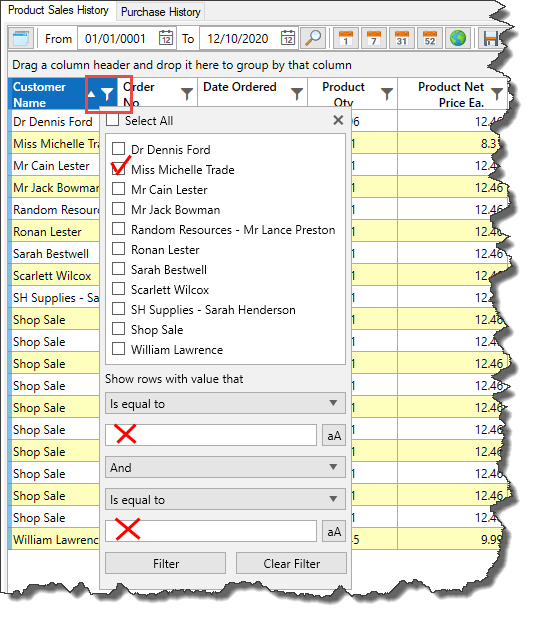
However if you select the Product Net Total column in the same example, you can either filter by the total by ticking the tickbox next to one of the amounts. Or you can use the filtering tools to show rows with a value that is greater than for instance, £15.00
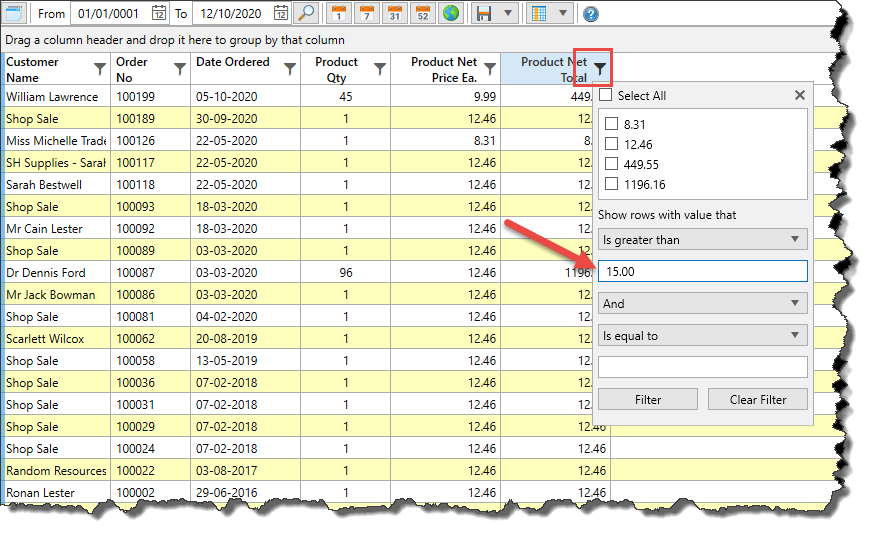
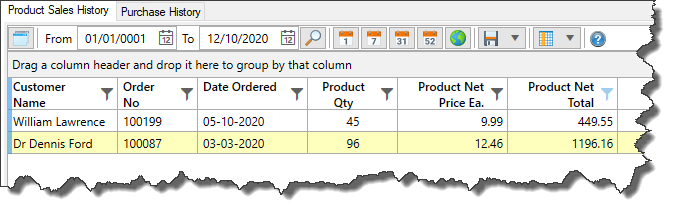
Click Filter and it will just show all the rows with a Product Net Total that is greater than £15.00
Click on the Funnel again and select Clear Filter to reset the filtering criteria. If you select another Product, the filtering criteria will still apply. However if you close the Products window and reopen it, the filtering criteria refreshes and is reset.
Grouping
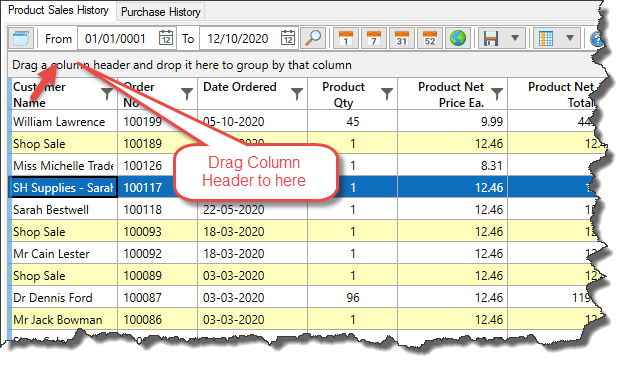
Grouping allows you to group by certain criteria. For instance you might wish to see how much each customer has spent on a certain product over a period of time.
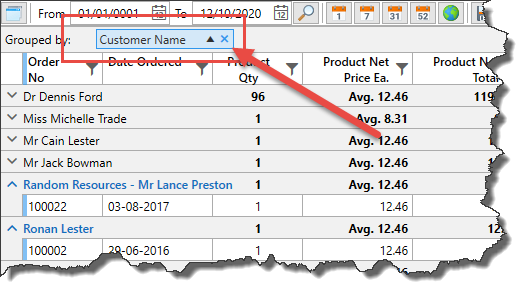
In order to do this, you would drag the Customer Name Column Header to the Group by section as shown below:
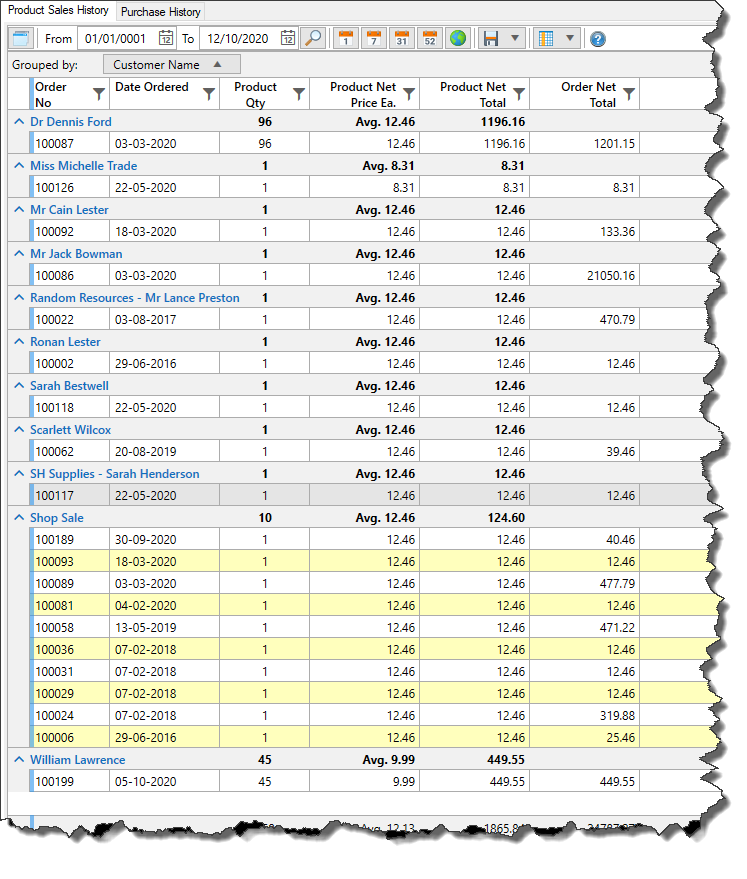
This then allows you to easily see how much each Customer has spent on this product over the given time period. Remember you can add additional columns to this view too:
To stop grouping, click on the cross (which will appear when you hover over it), next to Customer Name in the Group by section:
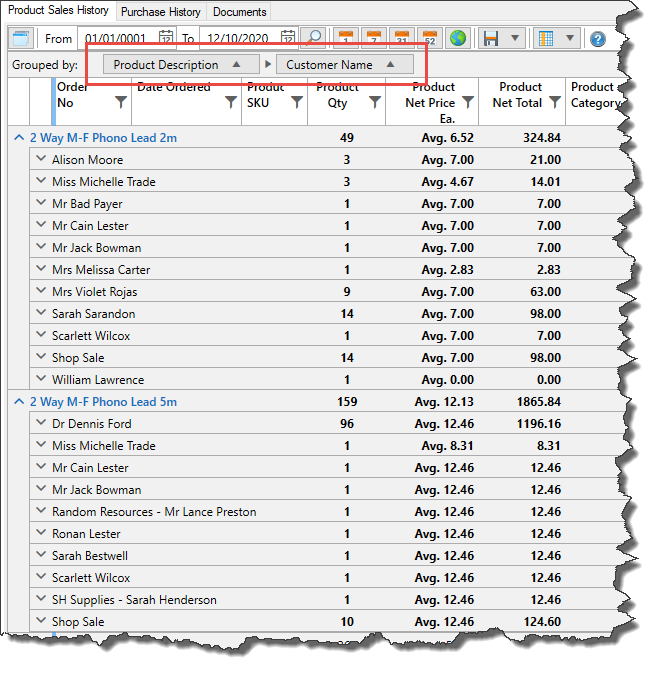
 You can also group by more than one criteria, by adding additional Column Headers to the Group by section.
In the scenario below (from the main Suppliers window) we have grouped by Product Description and Customer Name so we can see how many of each product was sold to each customer.
 You can change the sort criteria of how the data is grouped, by dragging the column headers around in the Group by section.
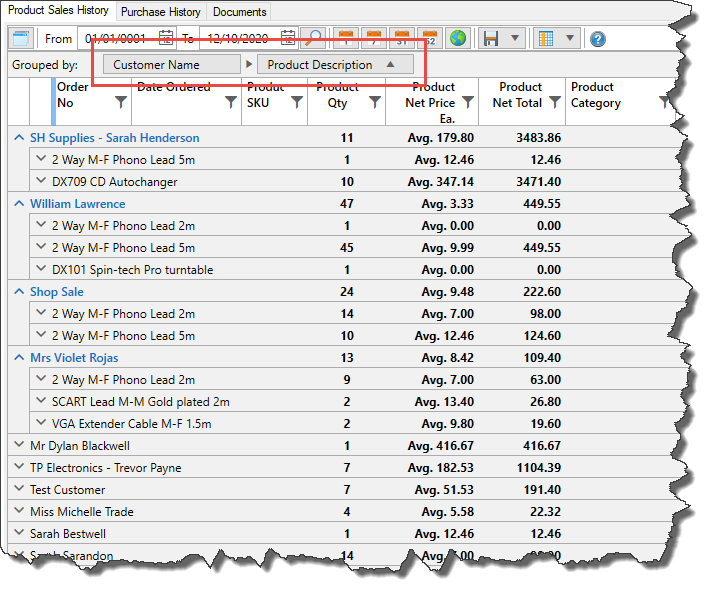
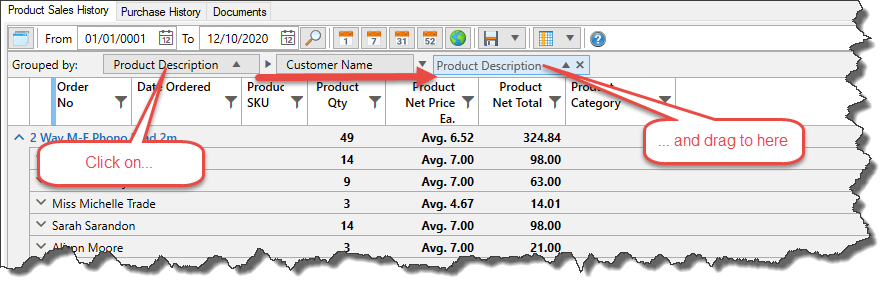 This will then display the same data but in a different group criteria, so now the results are grouped first by Customer Name and then by Product Description.
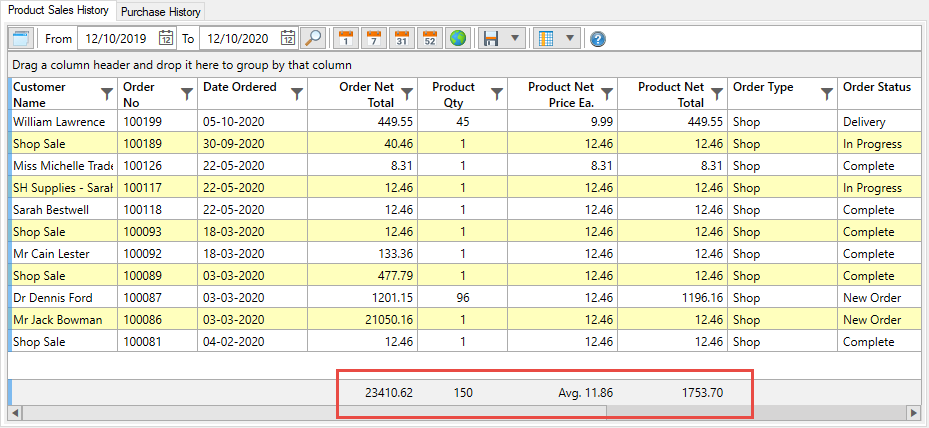
Column Totalising
As you Sort, Filter and Group your data in the Live Reporting pane, certain columns will Totalise the figures as you go.
Some columns will Totalise by adding up the values, while others will calculate an average value. Average value are shown with Avg in front of them.
The Live Reporting functionality was introduced in V4.77 so if you're not seeing the features on your version then you will need to upgrade.
